2024-07-08
한어Русский языкEnglishFrançaisIndonesianSanskrit日本語DeutschPortuguêsΕλληνικάespañolItalianoSuomalainenLatina
Support Vector Machine (SVM) was first proposed by Corinna Cortes and Vapnik in 1995. It has many unique advantages in solving small sample, nonlinear and high-dimensional pattern recognition.
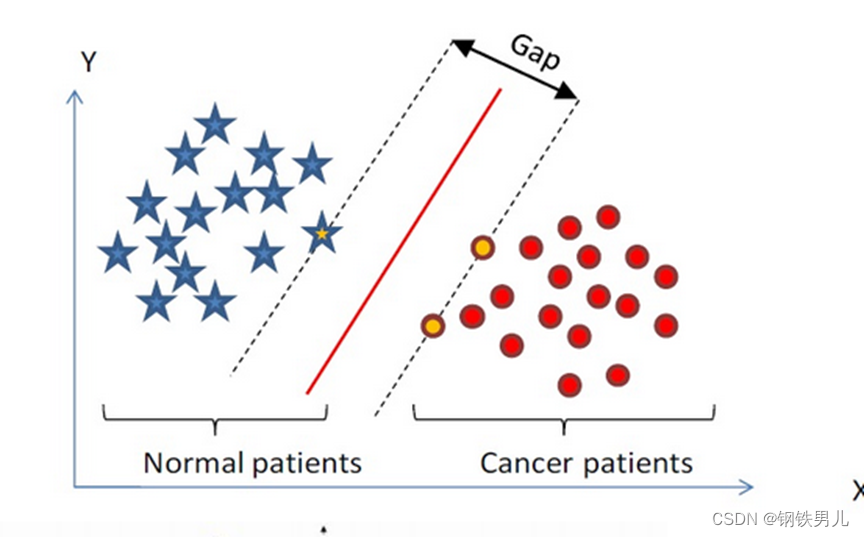
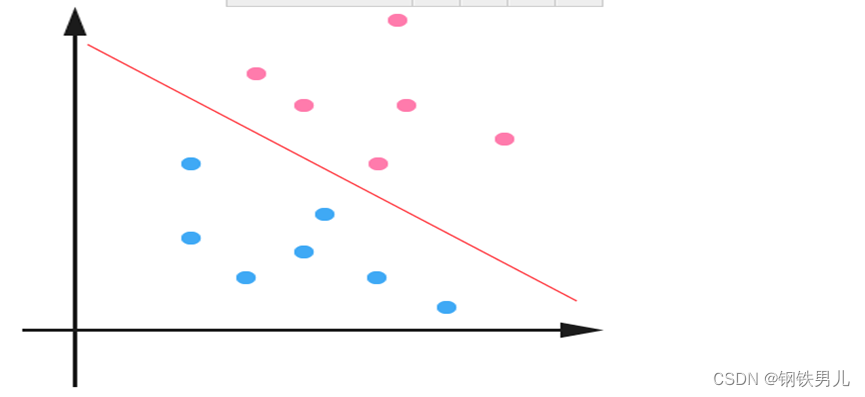
Find a classification hyperplane in n-dimensional space to classify the points in the space. The points on the dotted line are called support vector machines (SVMs), and the red line in the middle is called a hyperplane. The purpose of SVM is to increase the distance from all points to the hyperplane.
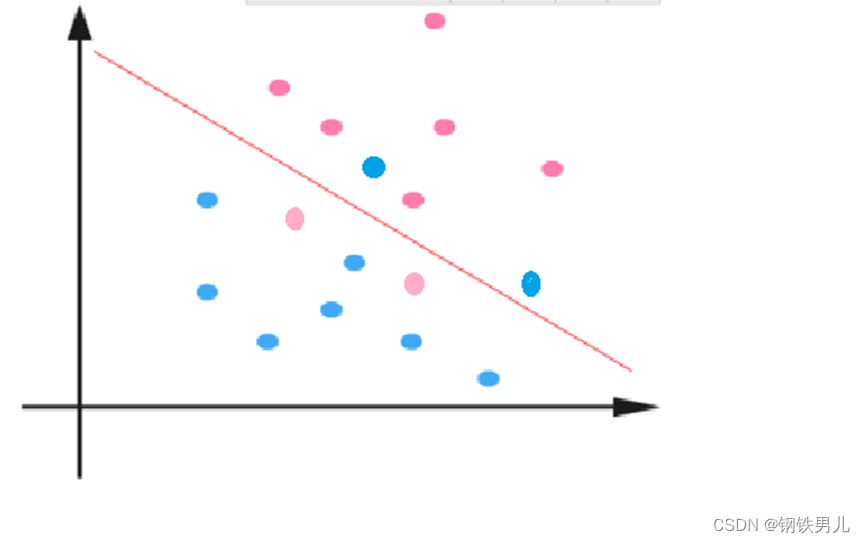
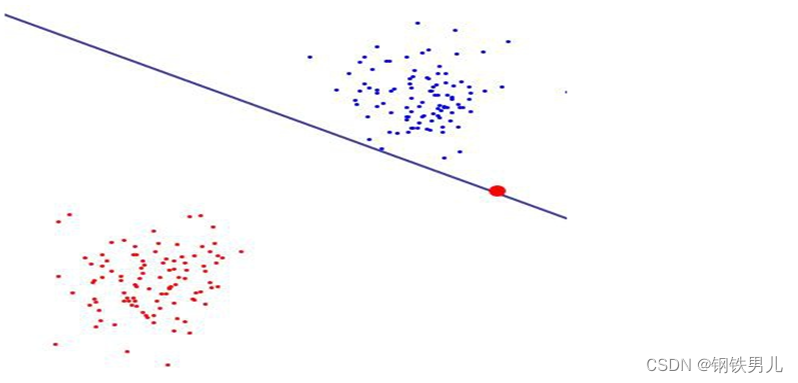
For the case of linear inseparability, our common practice is to map sample features into a high-dimensional space.
However, mapping to a high-dimensional space may result in too large a dimension, which makes the calculation complicated. Here, the kernel function is introduced;
Kernel function: also called nonlinear mapping, it maps sample features to a high-dimensional space and constructs the optimal hyperplane in this space.
Kernel function types: linear kernel, polynomial kernel, Gaussian kernel (rbf), etc.
Regularization constant C: refers to the degree of constraint of the Lagrange multiplier in SVM

The larger the regular constant value, the greater the penalty, the less tolerant the error, the more support vectors there are, and the more likely it is to cause overfitting.
On the contrary, the smaller the regularization constant is, the more likely it is to cause underfitting.
One-versus-all (one-versus-all method): During training, samples of a certain category are classified into one category, and the remaining samples are classified into another category. In this way, n SVMs are constructed from samples of n categories.
One-versus-one method: During training, an SVM is designed between any two types of samples in turn, so n types of samples require n(n-1)/2 SVMs to be designed.
canonical_variates: canonical correlation analysis. In linear regression, we use a straight line to fit the sample points and find the linear relationship between the n-dimensional feature vector X and the output result Y.
Principal component analysis: Principal component analysis (PCA) is a statistical procedure that uses an orthogonal transformation to transform the observed values of a set of possibly correlated variables into a set of linearly uncorrelated variables called principal components.

I have devoted myself to the research of technology for more than 30 years. I am proficient in various languages such as Java, Linux, JavaScript, PHP, CSS, etc. I have made many contributions in the field of open source. I have established a developer documentation site to share some problems in technology development for everyone to read.